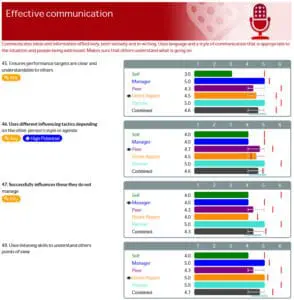
Every element of a report is offered as a selectable option for organisations, allowing them to choose the information included. All data is produced during reviews, ensuring its availability. Consequently, you have the flexibility to customise the size of your report without any impact on cost. Please note this flexibility is only available on 360 Options and 360 Unique, and is not available if you choose our 360 Instant solutions.
Example 360 Degree Feedback Report
Report Outputs and Options
Individual Report Summary
- Introduction- can be edited using the ‘Custom Text’ feature
- Reviewer group statistics (optional)
- Summary scores by competence
- Self-perception gap by competence (optional)
- Strengths/development areas charts (optional)
- Top/bottom scoring indicators (optional)
- Positive and Negative Difference (optional)
- High Potential Question Scores (Optional)
- Detail scores – Indicator scores per competence (optional)
- Review group tracker per competence (optional)
- PAPU-NANU (optional)
Below we have provided a more detailed description and visual representation of the above.
Report Introduction
The Personal Report introductions for 360 Options and 360 Unique are completely customisable and multiple report introductions can be created so each questionnaire can have a default report introduction if you wished to have a variety of assessments.
The 360 Instant reports do not include the High Potential Question Scores section, as what would indicate high potential needs to be agreed with each client, as it will be different for most organisations.
Include Question Detail
This enables us to provide a detailed overview of each question, or only summary competence scores are shown in the report.


Show Review Group Score Range
This adds additional lines to the competence and indicator diagrams for each question, showing the range between maximum and minimum scoring

Reviewer Statistics in Personal Report
This will show a table of the number of reviewers in each review group whose reviews have contributed to this personal report.

Self-Perception Gap In Personal Report
The self-perception gap compares an individual’s self-ratings against the average of all the other groups at a competence theme level.

Top and Bottom Questions
This will show the top and bottom scoring questions, as determined by their combined score. Also we can specify how many questions are shown.


Positive Difference & Negative Difference
If we agree that it would be useful to average the executive teams review and the head of functions review and show each individual how their individual results compare to the average of their colleagues, then this will be added to their reports.
Positive Difference
The positive difference chart below shows those indicators where the biggest, positive difference was observed between your behaviour and the comparison data. If people where reviewed at another point in the future the comparison data could also represent your own ratings from a previous 360; in this case, these items could be viewed as being those that are most improved, or where your development efforts have had the biggest impact.

Negative Difference
The negative difference chart below shows those indicators where the biggest, negative difference was observed between your behaviour and the comparison data. In the future if people are reviewed again the comparison data could also represent your previous ratings, in this case, these items could be viewed as being those where a decline in performance has been seen.

High Potential Question Scores
During the creation of the 360 assessment questionnaire if desired we will work with you to explore if any of the agreed indicators would be a strong indicator of high potential, if an individual achieved a high score. If so then this can be displayed in the report as shown below.

Strengths and Development Areas For Personal Report
The strengths and development areas chart is a spider diagram which compares an individual’s results against a standard which we agree. e.g. your own score or reference data that we agree, with you.

Spider Tracker
This table shows how the review groups have rated these indicators and you may see patterns and contrasts with and between the review groups.
![]()
SWOT Analysis - PAPU-NANU
This plots the individual’s results into Agreed Strengths, Development Areas, Good News and Hidden Talents therefore providing each individual with a clear developmental plan. Please note that we can change the name of this to something else e.g. Personal Development Plan etc.

Each of the four quadrants are then broken down by individual indicator. Below is an example of the developments in more detail.

To discuss our reporting capabilities call us on 01252 737536

